
Preventing Adverse Childhood Experiences: Data to Action
Welcome to the Georgia Preventing Adverse Childhood Experiences: Data to Action (PACE: D2A) webpage! Here you'll find data related to adverse childhood experiences (ACEs), student achievement, risk and protective behaviors, and much more.
The PACE: D2A team is committed to measuring and tracking data that support the prevention of ACEs in Georgia. With our partners at the Georgia Department of Public Health’s Injury Prevention Program, we've created a single location to access multiple ACE and ACE-related data sources.
These data are presented in a map and organized by state, region, county, and school district. Maps will be updated regularly, so please visit the site often!
Do you have additional data needs? Do you have questions about the data presented? Please send your inquiries or comments to our team at iprce@emory.edu.
This work is funded by the Georgia Department of Public Health through a cooperative agreement with the Centers for Disease Control and Prevention on Preventing Adverse Childhood Experiences: Data to Action (CDC-RFA-CE20-2006).
A special thank you to our data source partners and collaborators. Click here to learn more about these data sources.
Data Mapping Tool
Click the button below to explore the various data maps. Use this guide to easily navigate the tool.
Data Mapping Tool Survey
Click the button below to fill out the PACE: D2A Data Mapping Tool Survey. This survey helps the PACE: D2A team improve the data mapping tool.
PACE: D2A Data Literacy Presentation
Data can be an extremely helpful tool for ACEs prevention work. The PACE: D2A team is committed to making ACE data available, easy to access, understand, and use for prevention activities across Georgia. The presentation below goes over common data sets used to identify ACEs prevalence and risk and protective factors, understand the differences between datasets, and how to access ACE data maps via the PACE D2A mapping tool. Below the video, you can explore key concepts from the presentation.
Data Literacy Presentation Key Concepts
Click on the categories below to explore some key concepts from the ACEs data presentation.
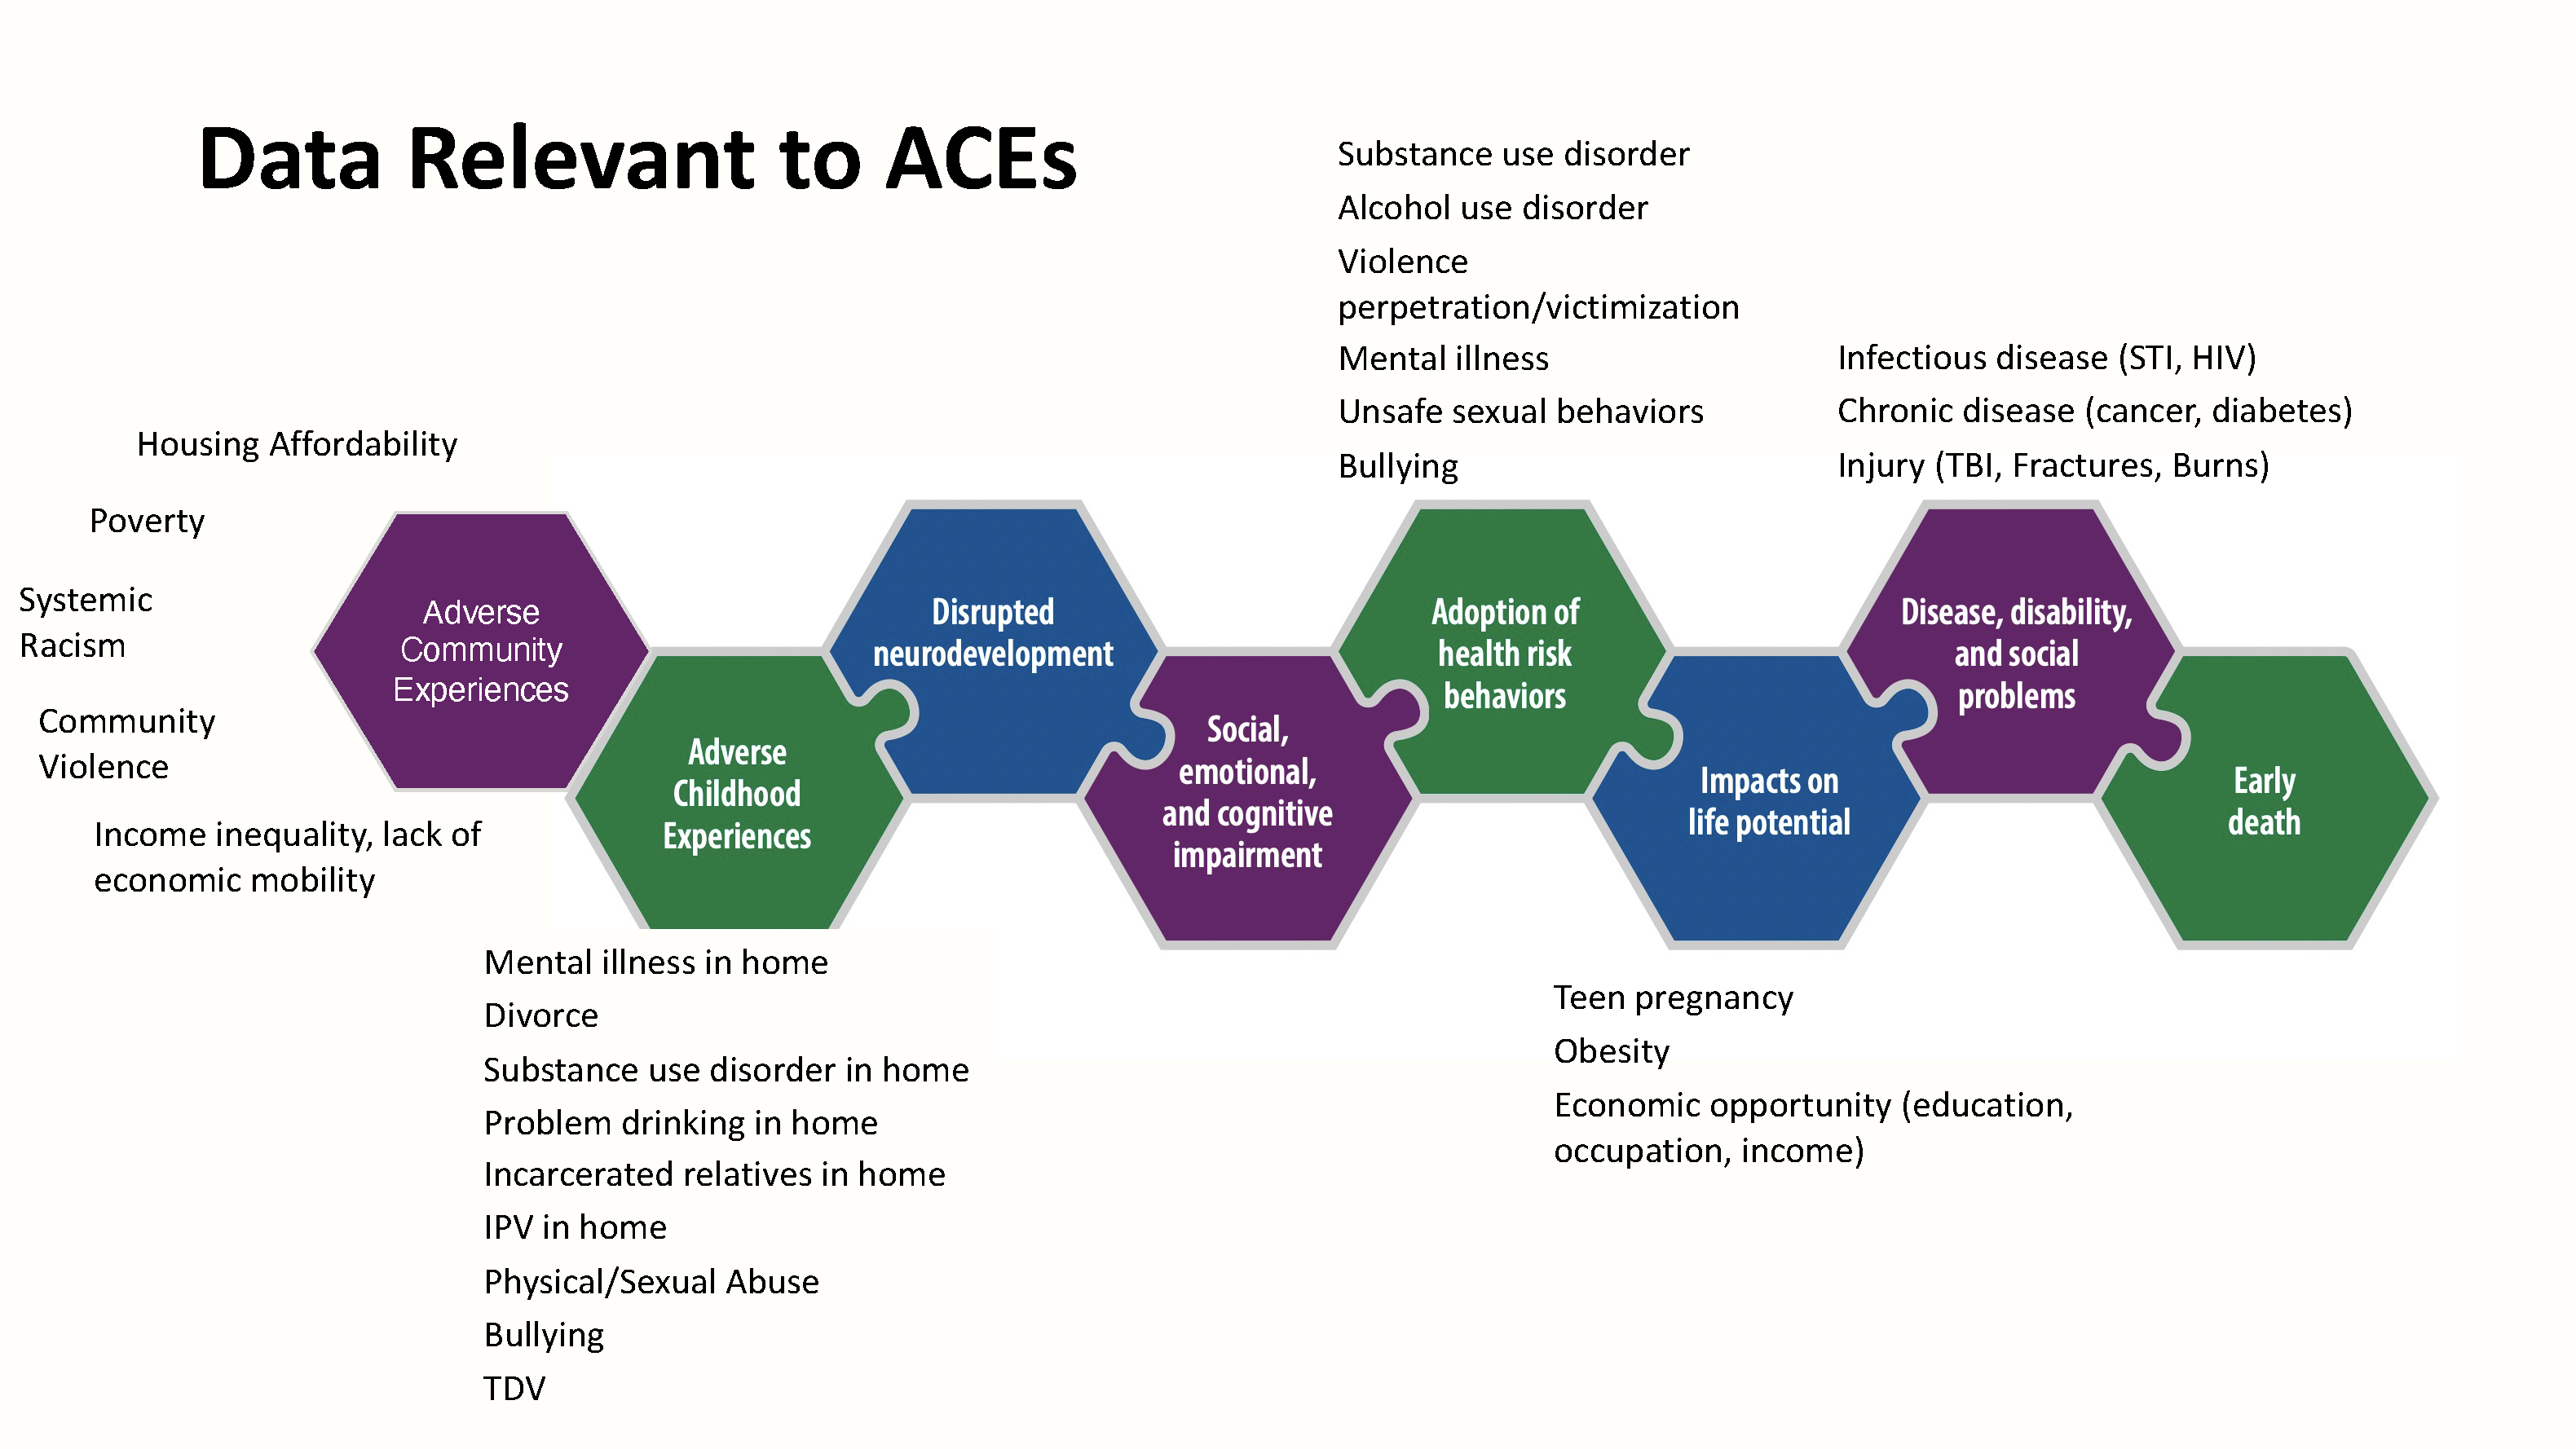
There are several data that are relevant to ACEs and ACE prevention work. The image below shows a causal chain between ACEs and early death and several related data points that are relevant for each category. While the original CDC version did not include adverse community experiences in the causal chain, we have included it as it is important to highlight that negative community experiences can contribute to ACEs. Housing affordability, bullying, mental illness, and economic opportunities such as income or level of education are different examples of data points one can use to inform different facets of their work in ACEs prevention.
The CDC lists six different strategies for ACEs Prevention. These include:
- Strengthen economic support to families
- Promote social norms that protect against violence and adversity
- Ensure a strong start for children
- Teach skills
- Connect youth to caring adults and activities
- Intervene to lessen immediate and long-term harms
Each strategy has a set of corresponding approaches that can be used to support and achieve the strategy. Below is a chart of the six CDC strategies and associated approaches, as well as possible relevant data and outcome indicators you could use to support work in the strategy. These are only a few suggestions of outcomes one could explore.
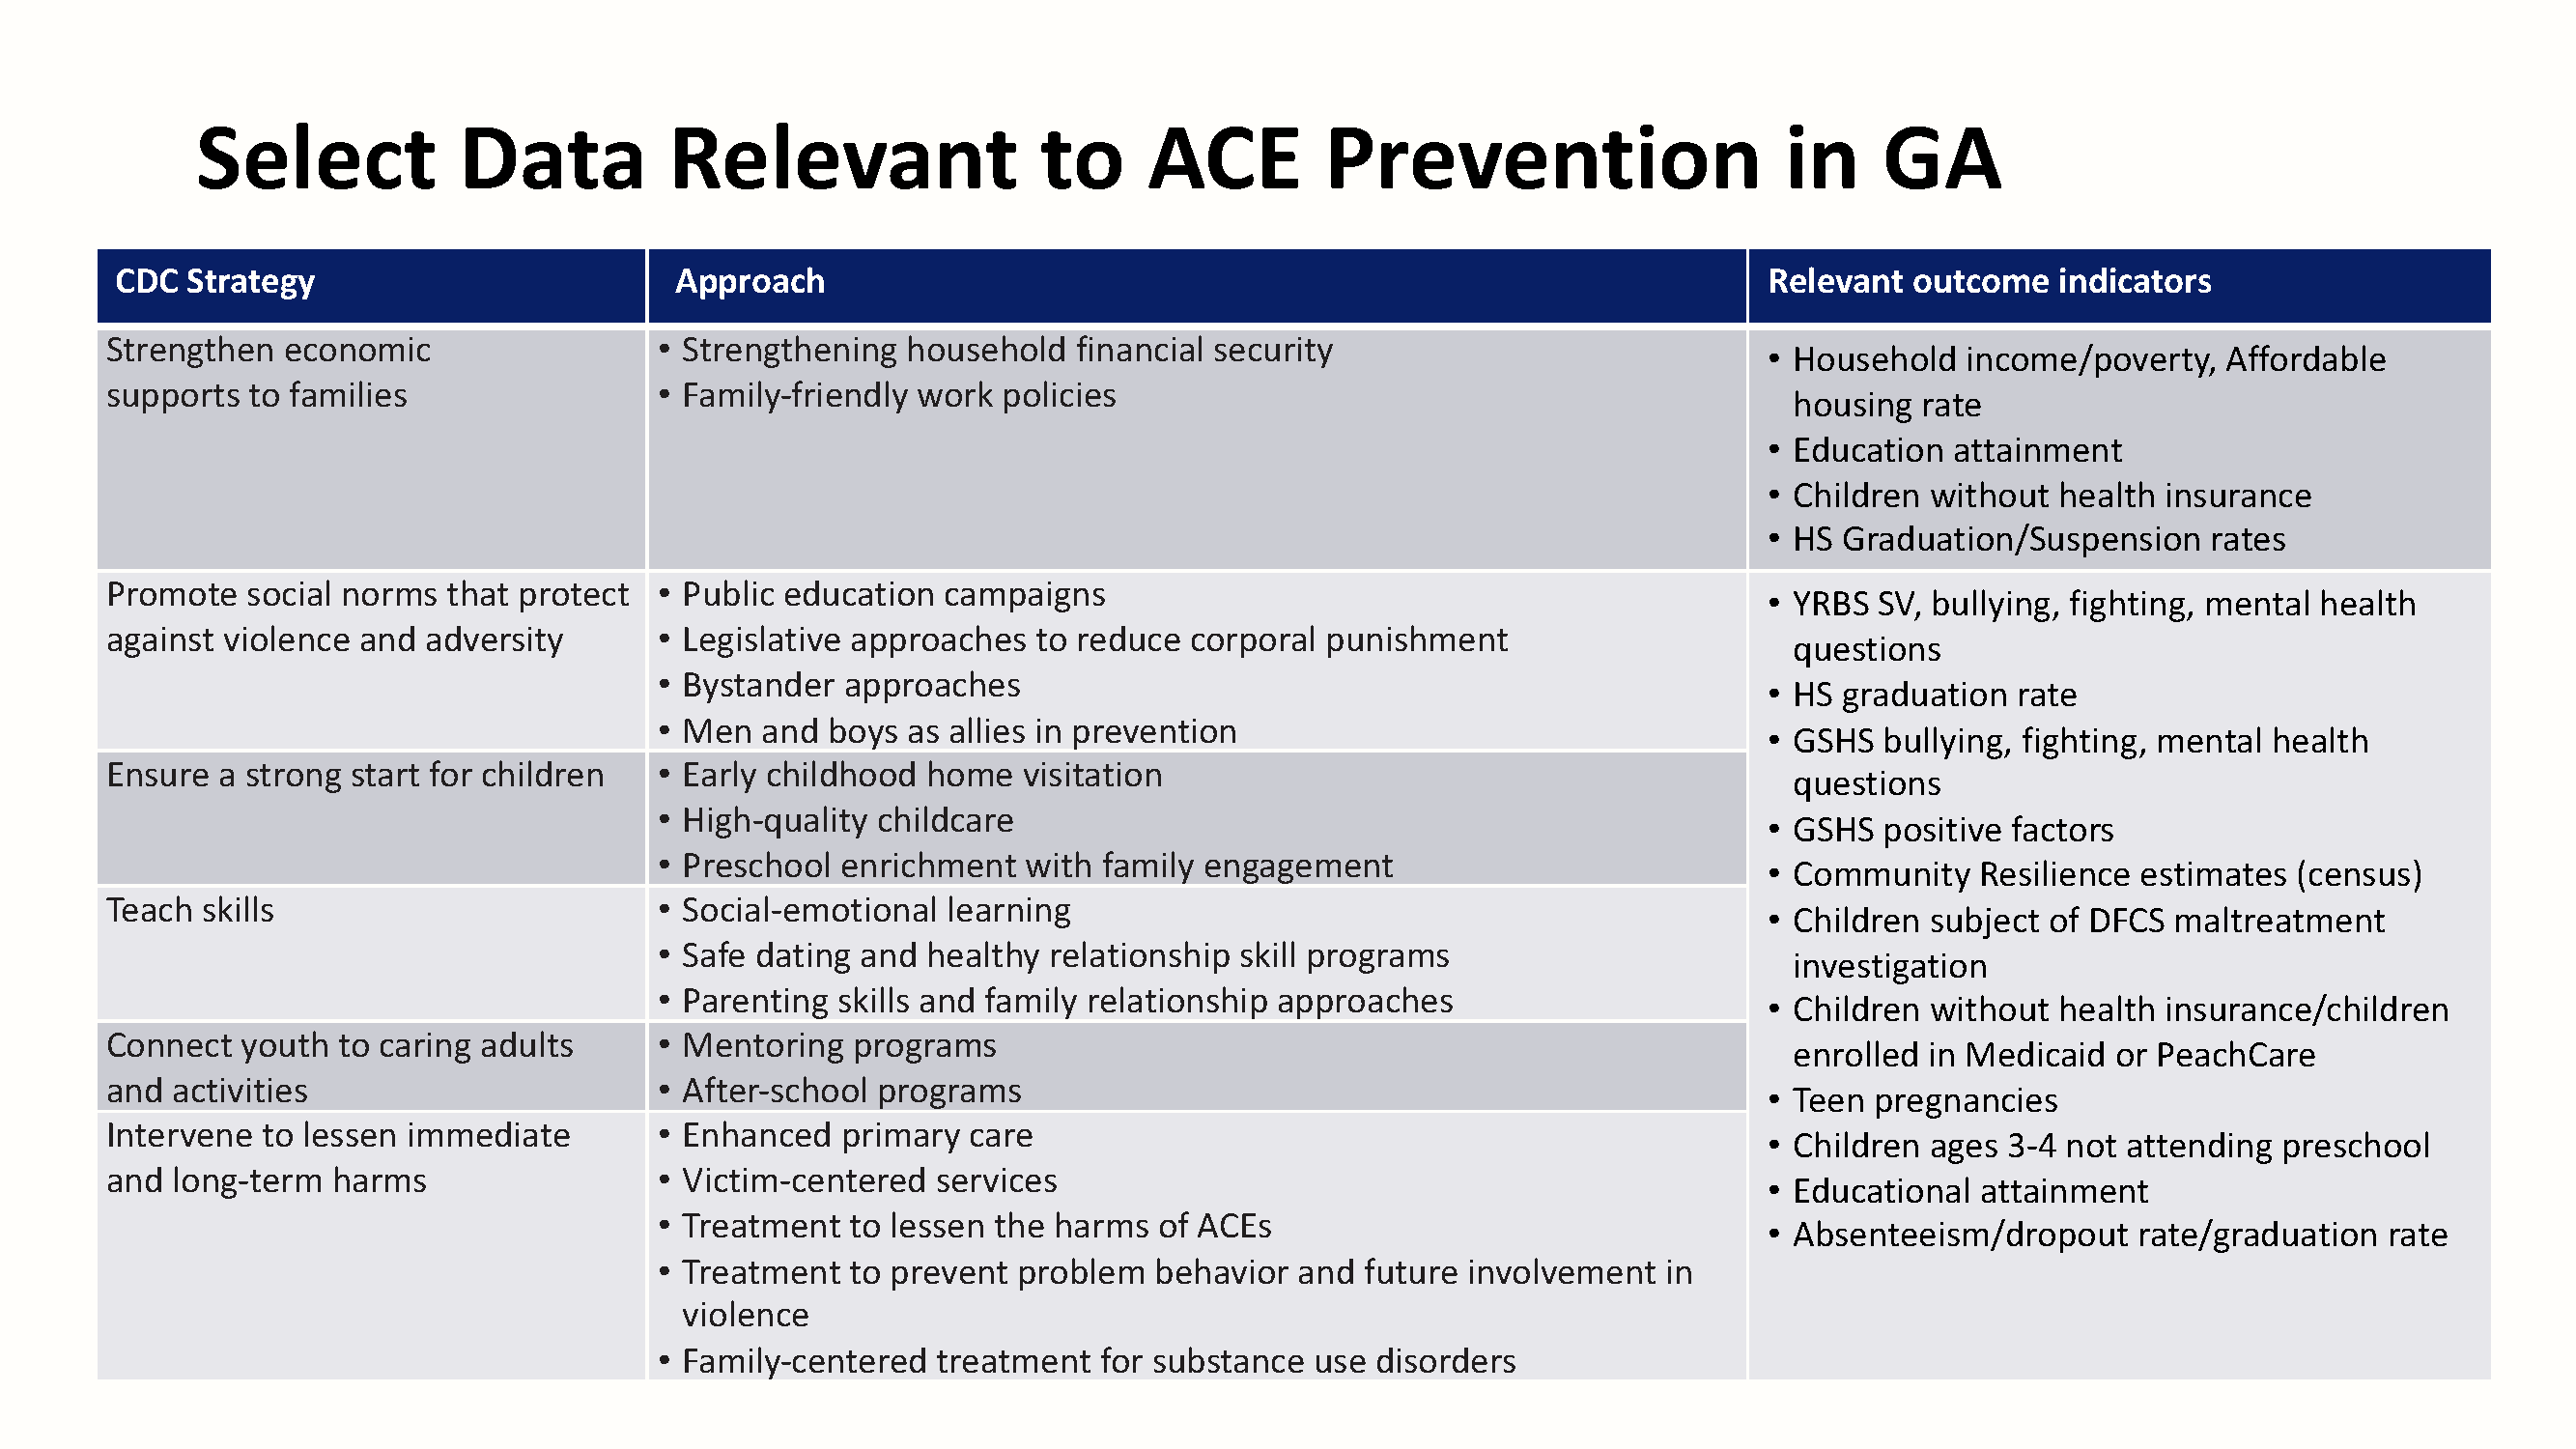
There are several data sources and outcome indicators within the PACE: D2A mapping tool you can access that are related to these strategies and approaches. Data sources that are relevant to ACE prevention in GA include:
- Census (decennial, American Community Survey, Small Area Income and Poverty)
- National Survey on Child Health
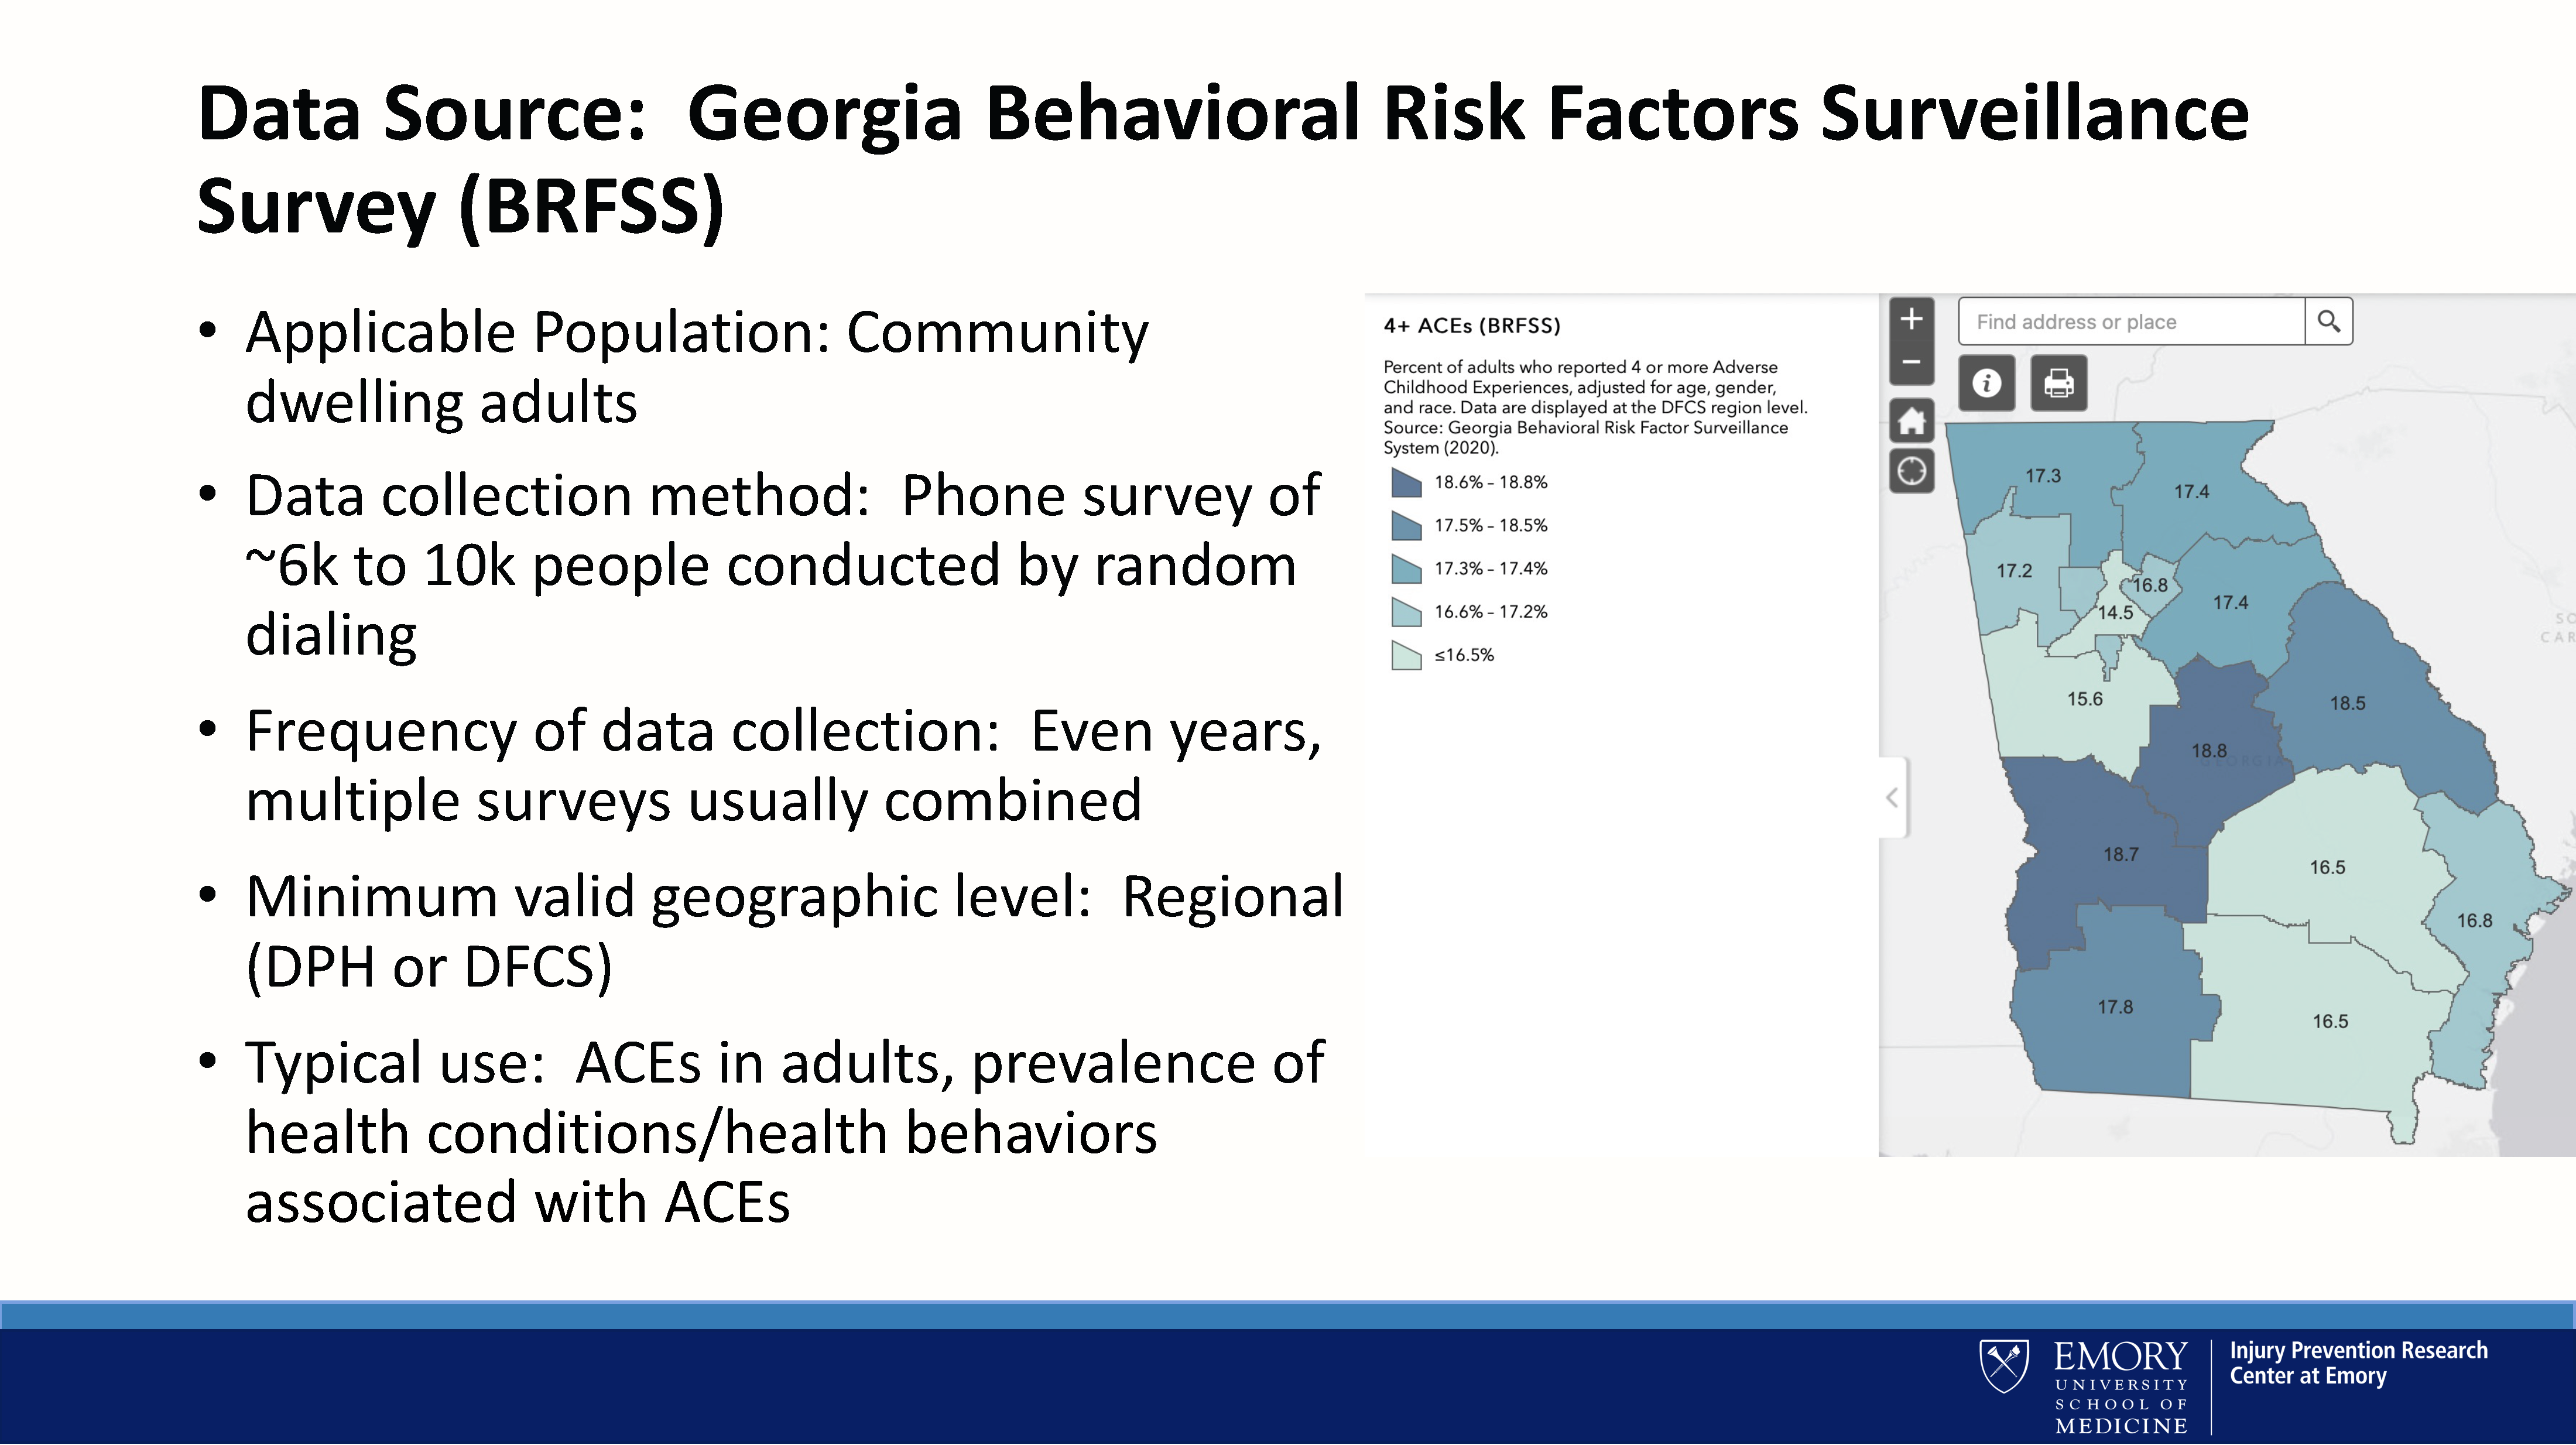
- Georgia Behavioral Risk Factors Surveillance Survey (BRFSS)
- Georgia Youth Risk Behaviors Survey (YRBS)
- Aggregate case data from the GA Department of Family and Child Services (DFCS)
- School data (GA Office of Student Achievement, Georgia Student Health Survey)
- GA Department of Early Care and Learning (DECAL)/Cross-Agency Child Data System (CACDS)/Get Georgia reading
Georgia Student Health Survey Analysis
The Georgia Student Health Survey (GSHS) is an annual survey administered to the majority of students in public schools in Georgia. The survey collects information on behaviors that are indicators of ACEs, such as bullying and fighting. The GSHS also collects important information on protective factors, such as positive relationships at school. A key feature of the GSHS is that it provides reliable estimates that are indicative of the prevalence of ACEs on a community level. Because the GSHS asks multiple questions on related behaviors, we have developed composite metrics that express the prevalence of key ACE risk and protective factor indicators. We have also developed single composite metrics that apply to all risk and protective factors identified in the GSHS. In the maps linked to each of the sections below, we express the composite metrics relative to the state median so that counties may be compared to each other and to the state average.
ACE Protective Factor Composite Score
This map shows the percentage of children in Grades 6-12 who scored above the state median for the ACE protective factor composite score. A higher percentage represents a greater rate of children self-reporting factors that mitigate the effects of ACEs based on GSHS responses and the literature. The composite score is a combination of six measures that address the following topics: prosocial interactions with other students, prosocial interactions involving teachers, positive factors at a school system level (e.g., feeling the students are recognized for good behavior and having high standards for achievement), the perceived quality of school facilities, and feelings of belonging at school.
ACE Risk Factor Composite Score
This map shows the percentage of children in Grades 6-12 who scored above the state median for the ACE risk factor composite score. A higher percentage represents a greater rate of children self-reporting behaviors that are ACEs, or that are strongly associated with the occurrence of ACEs. The composite score is a combination of five measures derived from GSHS responses. These measures are related to substance use, bullying/fighting, anxiety/depression, feeling unsafe at school, and self-harm behaviors.
POSITIVE STUDENT INTERACTIONS
The map shows the percentage of children in Grades 6-12 who scored above the state median for reported prosocial interactions with other students. A higher percentage represents a greater rate of children in Grades 6-12 self-reporting the presence of positive prosocial behaviors at school, such as students treating each other fairly and with respect, and keeping the school in good condition.
Substance Use
The map shows the percentage of children in Grades 6-12 who scored above the state median for substance misuse. A higher percentage represents a greater rate of children in Grades 6-12 self-reporting substance use behaviors, such as drinking alcohol, smoking cigarettes, and using prescription pain medicine without a doctor's prescription.
POSITIVE STUDENT-TEACHER INTERACTIONS
The map shows the percentage of children in Grades 6-12 who scored above the state median for observing prosocial interactions involving teachers. A higher percentage represents a greater rate of children in Grades 6-12 self-reporting being treated with respect by teachers, and teachers treating other students fairly.
Bullying and Fighting
The map shows the percentage of children in Grades 6-12 who scored above the state median for bullying. A higher percentage represents a greater rate of children in Grades 6-12 self-reporting being bullied online or physically, getting into physical fights, and being hit, pushed, or kicked at school.
POSITIVE SCHOOL ENVIRONMENT
The map shows the percentage of children in Grades 6-12 who scored above the state median for reporting prosocial interactions involving teachers. A higher percentage represents a greater rate of children in Grades 6-12 self-reporting knowing a supportive adult at school, feeling that students are recognized for good behavior, and feeling that schools have high standards for achievement.
ANXIETY AND DEPRESSION
The map shows the percentage of children in Grades 6-12 who scored above the state median for anxiety/depression. A higher percentage represents a greater rate of children in Grades 6-12 self-reporting symptoms of anxiety/depression, such as feeling withdrawn and overwhelmed with fear and intense worry.
QUALITY OF SCHOOL BUILDINGS AND MATERIALS
The map shows the percentage of children in Grades 6-12 who scored above the state median for responses related to schools being clean and well maintained.
Data on ACEs in Georgia
Adverse Childhood Experiences (ACEs) are potentially harmful events or household factors occurring in childhood that may increase a person’s risk for developing chronic and mental health issues later in life. They can also have negative impacts on life opportunities and socioeconomic factors such as educational achievement and employment. In Georgia, ACEs have an impact on several physical and mental health problems as well as health behaviors and social outcomes. Surveys such as the Behavioral Risk Factor Surveillance System Survey (BRFSS) allow us to examine a variety of ACEs and their impact on youth and adult populations in Georgia. The following tables show the results and analysis of responses to the ACEs items from the BRFSS from 2016, 2018, and 2020. Please visit our source list for more information on the BRFSS.
The following table is the combined responses to the ACEs items of the Georgia Behavioral Risk Factor Surveillance System (BRFSS) surveys from the 2016, 2018, and 2020. Approximately 16% of respondents reported at least 4 ACEs. The most reported ACEs were experiencing one’s parents insulting/swearing at (28.9%) and divorced parents (27.4%).
Percentage of Respondents who Report Adverse Childhood Events
Adverse Childhood Experiences | Percent (95% CI) | Adjusted Percent (95% CI) † |
≥ 4 ACEs | 19.4 (18.7-20.2) | 16.3 (15.6-17.1) |
Lived with someone depressed, mentally ill, suicidal | 15.4 (14.7-16.1) | 12.3 (11.7-12.9) |
Lived with alcoholic | 22.5 (21.7-23.3) | 21.7 (21-22.5) |
Lived with someone who used drugs | 9.8 (9.2-10.3) | 7.1 (6.6-7.7) |
Lived with someone who had been to prison | 8.7 (8.1-9.3) | 6.5 (6-7) |
Parents divorced | 30.4 (29.5-31.3) | 27.4 (26.5-28.2) |
Parents hit, kicked, punched, or beat each other | 17.6 (16.9-18.3) | 16.5 (15.8-17.2) |
Parents hit, kicked, hurt you | 20.1 (19.3-20.8) | 19.1 (18.4-19.9) |
Parents swear at, insult you | 31.4 (30.5-32.3) | 28.9 (28-29.7) |
Touched by someone 5+ years older | 13.1 (12.4-13.7) | 10.9 (10.3-11.6) |
Made to touch someone 5+ years older | 10.1 (9.5-10.7) | 8.2 (7.6-8.7) |
Forced to have sex with someone 5+ years older | 6.7 (6.2-7.1) | 5.3 (4.8-5.7) |
†Percentages were adjusted for age, gender, and race
This table contains the percentage of respondents who indicated experiencing ACEs in the 2016, 2018, and 2020 Behavioral Risk Factor Surveillance System Survey (BRFSS). In general, respondents have become more likely to confirm experiencing ACEs over time. These results were adjusted for age, race, and sex.
Adverse Childhood Experiences | 2016 | 2018 | 2020 |
≥ 4 ACEs | 13.2 (11.9-14.5) | 14.3 (13.2-15.5) | 18.0 (16.8-19.2) |
Lived with someone depressed, mentally ill, suicidal | 11.1 (10-12.4) | 12.4 (11.5-13.3) | 12.2 (11.2-13.3) |
Lived with alcoholic | 20.4 (18.9-21.9) | 21.2 (20.1-22.2) | 22.2 (21-23.5) |
Lived with someone who used drugs | 4.6 (3.9-5.5) | 7.1 (6.3-7.9) | 7.4 (6.7-8.3) |
Lived with someone who had been to prison | 4.8 (4.1-5.7) | 5.6 (4.9-6.3) | 7.4 (6.6-8.2) |
Parents divorced | 23.5 (21.9-25.2) | 27.2 (26-28.4) | 28.6 (27.2-30) |
Parents hit, kicked, punched, or beat each other | 17.4 (16-18.8) | 15.4 (14.5-16.3) | 16.5 (15.4-17.6) |
Parents hit, kicked, hurt you | 14.1 (12.9-15.3) | 14.5 (13.6-15.5) | 23 (21.8-24.3) |
Parents swear at, insult you | 25.5 (23.9-27.1) | 27.4 (26.2-28.6) | 30.5 (29.1-31.9) |
Touched by someone 5+ years older | 8.4 (7.4-9.5) | 9.7 (8.9-10.5) | 12.3 (11.2-13.4) |
Made to touch someone 5+ years older | 5.4 (4.6-6.5) | 7.2 (6.5-8) | 9.4 (8.5-10.3) |
Forced to have sex with someone 5+ years older | 3.5 (2.9-4.3) | 3.9 (3.4-4.5) | 6.3 (5.7-7.1) |
The following table is the result of the structural equation model (SEM) used to evaluate the association between ACEs and health-related behaviors and outcomes in Georgia. The standardized coefficients range from -1.0 to +1.0, where a value of +1 indicates that an outcome is completely explained by ACEs. In Georgia, ACEs have an impact on several physical and mental health problems, as well as health behaviors and social outcomes. The health-related outcome most strongly predicted by ACEs was a diagnosis of depression.
Standardized Total, Direct, and Indirect Effects of ACEs in the Structural Equation Model
Outcome | Total Effect (95% CI) | Direct Effect (95% CI) | Indirect Effect (95% CI) |
Depression | 0.265 (0.248 - 0.28) | 0.204 (0.182 - 0.226) | 0.06 (0.046 - 0.076) |
Days with Poor Mental Health | 0.234 (0.218 - 0.251) | 0.085 (0.07 - 0.1) | 0.15 (0.14 - 0.159) |
Smoking | 0.187 (0.172 - 0.203) | 0.123 (0.108 - 0.139) | 0.064 (0.057 - 0.071) |
Skipped Med Appt (Cost) | 0.179 (0.162 - 0.195) | 0.144 (0.128 - 0.159) | 0.036 (0.03 - 0.041) |
Days Health Prevented Usual Activities | 0.176 (0.161 - 0.193) | 0.025 (0.011 - 0.038) | 0.152 (0.141 - 0.163) |
Risky HIV Behavior | 0.172 (0.152 - 0.191) | 0.156 (0.136 - 0.175) | 0.016 (0.01 - 0.022) |
General Health Rating | 0.154 (0.14 - 0.168) | 0.003 (-0.009 - 0.014) | 0.151 (0.14 - 0.162) |
Days with Poor Physical Health | 0.15 (0.134 - 0.165) | 0.026 (0.012 - 0.041) | 0.123 (0.115 - 0.132) |
COPD | 0.129 (0.113 - 0.144) | 0.05 (0.035 - 0.065) | 0.079 (0.072 - 0.087) |
Arthritis | 0.119 (0.105 - 0.132) | 0.067 (0.053 - 0.08) | 0.052 (0.046 - 0.057) |
Childhood Asthma | 0.106 (0.089 - 0.122) | 0.085 (0.069 - 0.101) | 0.02 (0.017 - 0.024) |
Current Asthma | 0.102 (0.086 - 0.12) | 0.011 (0.002 - 0.02) | 0.092 (0.078 - 0.105) |
Income | -0.10 (-0.115 - -0.086) | -0.055 (-0.067 - -0.043) | -0.045 (-0.053 - -0.037) |
Alcohol Use | 0.087 (0.069 - 0.106) | 0.122 (0.077 - 0.166) | -0.035 (-0.077 - 0.008) |
PACE: D2A Factsheets
Over the course of this program and in collaboration with Essentials for Childhood workgroups and the Department of Public Health, factsheets were developed and disseminated directly to stakeholder groups. These factsheets serve to raise awareness about ACEs and the disparate burden, provide timely ACE surveillance data, and highlight ACE prevention strategies. The factsheets are presented below by the Division of Family and Children Services (DFCS) regions.
Click here to view previous versions of the Georgia Student Health Survey (GSHS) factsheets, Child Abuse and Neglect Prevention Plan (CANPP) factsheets, and state-level composite score maps.
Community Resources
Preventing childhood adversity begins with healthy and positive communities. The actions we take now to build communities with accessible resources, social support, and a sense of safety can help children thrive even when facing difficult experiences. Our team promotes organizations, strategies, and interventions that support positive childhood experiences (PCEs). Please visit the resources below!
Prevent Child Abuse (PCA) Georgia is the Georgia state chapter of PCA America, whose aim is to prevent abuse and neglect of children by providing direction to build safe and nurturing environments for children and families.
Georgia’s Child Abuse & Neglect Prevention Plan (CANPP) provides strategies for families, societies, and systems/ governments for collective action to help children and families.
Belonging for Hope is a multi-organization supported campaign that provides resources on creating safe spaces for children to grow and receive the care and support they need to thrive.
CDC’s Essentials for Childhood (E4C) is a warehouse of strategies and resources that support the promotion of relationships and environments that are safe and stable for young children.
NCIPC’s Adverse Childhood Experiences Prevention Strategy provides a comprehensive approach to mitigating ACEs with evidence-based primary-level prevention strategies.